Introduction
This work adresses the question, which role vowel-information plays when hierarchically clustering German dialects. When comparing the results of three different settings of the data (unmodified vowel information; vowels replaced by „V“; vowels completely removed), it can be observed that in each case the data strongly tends to form the same three main clusters, corresponding to the large dialect-areas Upper German, Low German/East Central German and West Central German. The fact that each setting approximately gives the same result suggests that vowels only play a minor role for phonotactically clustering German dialects, although they make up 30% of the data.
There are already a couple of works in German dialectology that make use of hierarchical clustering and other statistical similarity-based methods. A large cluster-analysis based on Levenshtein distance of selected words from the PAD-corpus (see next section) was used by Nerbonne and Siedle (2005), who found that the result of their quantitative approach corresponds to the categorisation of traditional German dialectology. Other publications applied similarity measures to smaller areas, like Lameli (2014) using Neighbor-Nets on Swabian (see McMahon 2005 for more on Neighbor-Nets) and Birkenes (2019) calculating character-trigram cosine-distances of 55 North-Frisian Wenker questionnaires.
Data
The current analysis uses annotated audio-data from the Phonetic Atlas of Germany (Phonetischer Atlas von Deutschland; PAD) by Göschel (1992; 2000). From 1956 to 1990, native dialect speakers from 186 locations in Germany were given the task to translate the so-called Wenker sentences into their respective dialects. A readout of this translations was recorded on tape. To ensure dialect-competence, these speakers were selected from the group of so-called NORMs (Non-mobile, Old, Rural Males; see Chambers and Trudgill 1998). From 1980 to 1995, narrow phonetic transcriptions were made from all monosyllabic words, which make up the PAD-corpus.
Currently, our project is preparing broad, phonological transcriptions of the full PAD-material. Students first cut out the interviewer from the original recording and then they make two orthographic transcripts: A dialect version and a (translated) standard German version. From these transcripts, two Praat-textgrids are created with the online-forced-aligner WebMAUS (Schiel 1999; Kisler et al. 2017). In a last step, the resulting textgrid is manually corrected. The corrected textgrids are then combined in csv-format. Since our project is work in progress, the data is not complete yet. At the moment, it consists of 25 aligned recordings (for the locations, see the dendrograms below).
Because the texts that the interviewers presented to the speakers tend to vary more or less strongly, it was necessary to reduce the data to those phrases of the Wenker sentences that were spoken by all participants to avoid any bias resulting from template similarity. For each speaker, the SAMPA-annotated dialect-words were split into separate sounds (except affricates and diphtongs) and these were grouped into bigrams. As an example, the bigrams for the word g@bli:b@n are shown in (1). For each bigram, the probability (frequency divided by the total amount of bigrams) was calculated separately for each speaker and the resulting matrix was used as input for hierarchical clustering.
- g@, @b, bl, li:, i:b, b@, @n
The data was analysed by using hiearchical cluster analysis with the statistics software R. Hierarchical clustering is a group of distance-based methods which are applied to calculate the similarity between objects (Jain and Dubes, 1988). Ward (1963) suggests an agglomerative approach taking a bottom-up-perspective: First, each object is treated as an individual cluster and step by step, objects are combined to larger clusters by pairwisely merging those being most similar to each other. The graphical representation of such a cluster-analysis is the so-called dendrogram in which the leaves represent the individual objects and the nodes stand for the clusters of all the objects below them. For this analysis, hierarchical clustering was done using the R‑package pvclust (Distance = Ward; Method = Average) by Suzuki and Shimodaira (2006).
Results
Hierarchical clustering was done with three different settings: (i) unmodified, (ii) all vowels changed to „V“ and (iii) all vowels completely removed.
1. Setting: Unmodified
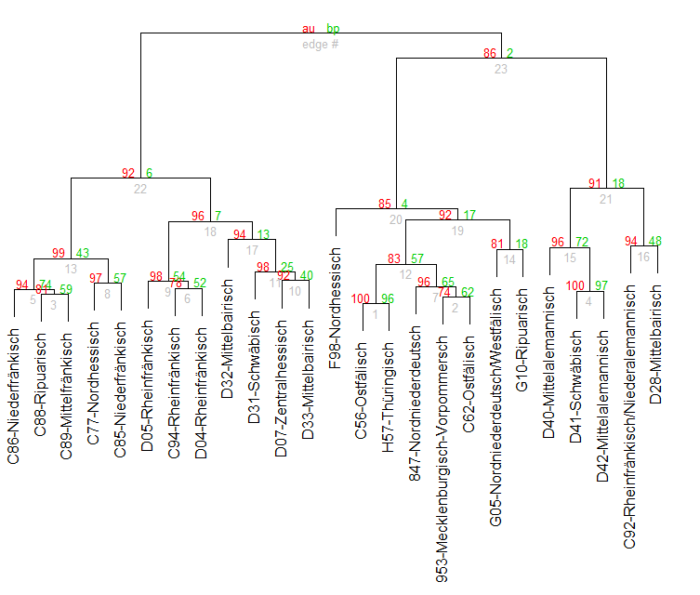
Fig. 1 shows the dendrogram which is obtained when clustering data with unmodified vowel information. The red numbers give the AU-p-value (“approximately unbiased p-value for non-selective inference”) which indicates how well clusters are supported by the data (Suzuki and Shimodaira, 2015). The green numbers give the bootstrap probability value. However, this green value is much less accurate than the red AU values (Suzuki and Shimodaira, 2015). The grey numbers simply represent a random identifier for a certain cluster. The dendrogram in Fig. 1 shows three large groups: Cluster 22 (p-value 92%) mainly contains recordings from the West Central German area (and a few Upper German recordings), cluster 20 (p-value 85%) mostly consists of Lower German and East Central German recordings and in cluster 21 (p-value 91%), only Upper German recordings are grouped together. These three groups correspond to known German dialect classifications such as Wiesinger (1983), König (2005), Nerbonne and Siedle (2005) or Girnth (2007). This suggests that phonotactic information plays an important role for distinguishing broader dialect areas.

2. Setting: Vowels changed to „V“
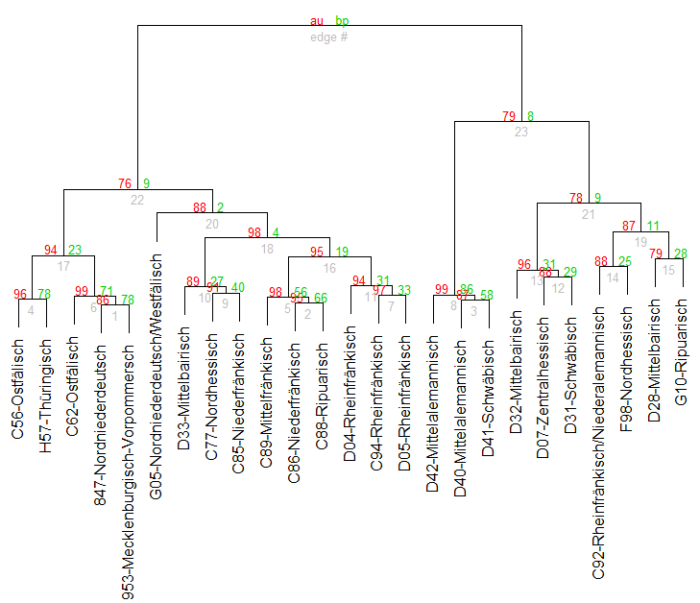
In the second setting, vowel-quality-information is removed from the data by simply replacing all vowels by „V“; as an example, g@bli:b@n became gVblVbVn. Fig. 2 shows the resulting dendrogram. It consists of two main clusters, where Cluster 23 (p-value 79%) mostly contains recordings from the Upper German area and Cluster 22 (p-value 76%) is further subdivided into a Low German/East Central German cluster (Cluster 17; p-value 94%) and a West Central German cluster (Cluster 20; p-value 88%). This suggests that when vowel-quality information is removed, it is still possible to phonotactically group German dialects.

3. Setting: Vowels completely removed
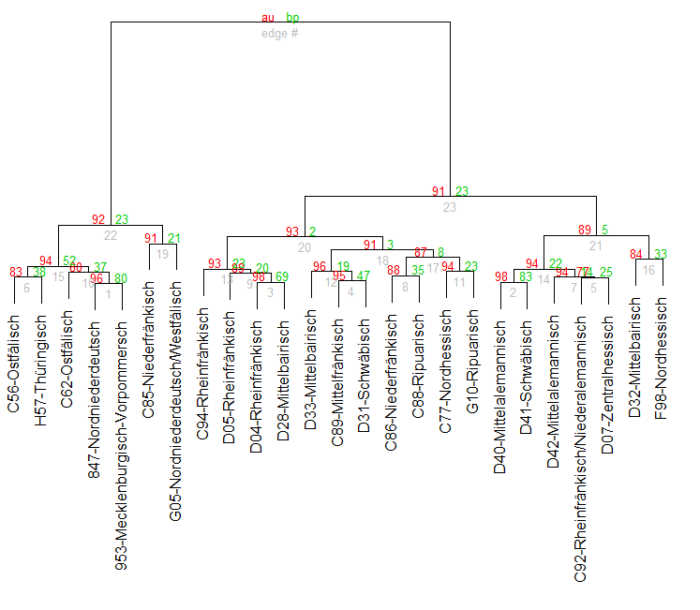
Even stronger, when vowels are completely removed (g@bli:b@n became gblbn), the three main clusters still remain as shown in Fig. 3: Low German/East Central German in Cluster 22 (p-value 92%), West Central German in Cluster 20 (p-value 93%) and Upper German in Cluster 21 (p-value 89%). This indicates that even if vowel-position information is not available, larger German dialect groups can be still distinguished based on phonotactics.

Conclusion
Vowels make up around 30% of the data used in this work. However, the three clustering analyses show that they do not play a big role for the phonotactic grouping of German dialects. In all three settings, approximately the same three large groups were present in the dendrograms: Low German/East Central German, West Central German and Upper German. Surprisingly, the clearest picture was obtained under the third, no-vowel-setting. In this dendrogram only a few outliers from West Central German are in the Upper German cluster and vice versa.
Literature
- Birkenes, Magnus Breder (2019): North Frisian dialects: A quantitative investigation using a parallel corpus of translations. Us Wurk 68.3–4: 119–168. https://doi.org/10.21827/5c98880d173a4
- Chambers, J.K. / Peter Trudgill (1998): Dialectology. 2nd edn. Cambridge: Cambridge University Press. https://doi.org/10.1017/CBO9780511805103
- Girnth, Heiko (2007): Variationslinguistik. In: Steinbach, Markus, et al.: Schnittstellen der germanistischen Linguistik. Stuttgart: Metzler, 187–217. https://doi.org/10.1007/978-3-476-05042-7_6
- Göschel, Joachim (1992): Das Forschungsinstitut für Deutsche Sprache ‘Deutscher Sprachatlas’. Wissenschaftlicher Bericht. Marburg: FIDS.
- Göschel, Joachim (2000). Der Phonetische Atlas von Deutschland. ЈyжноcлoвенcкиФилолог 56: 283–288.
- Jain, K. / R. C. Dubes (1988): Algorithms for Clustering Data, Prentice Hall, Englewood Cliffs, New Jersey.
- König, Werner (2005): dtv-Atlas deutsche Sprache.
- Lameli, Alfred (2014): Distanz als raumstrukturelle Eigenschaft dialektaler Kontaktsituationen. Eine Analyse des Schwäbischen. Dominique Huck (Hg.): Alemannische Dialektologie: Dialekte im Kontakt. Beiträge zur 17: 67–86.
- McMahon, April / Robert McMahon (2005): Language classification by numbers. Oxford: University Press.
- Nerbonne, John / Christine Siedle (2005): Dialektklassifikation auf der Grundlage aggregierter Ausspracheunterschiede. Zeitschrift für Dialektologie und Linguistik: 129–147.
- Schiel, Florian (1999): Automatic Phonetic Transcription of Non-Prompted Speech. Proc. of the ICPhS, 607–610.
- Kisler, T. / Reichel U. D. / Schiel, F. (2017): Multilingual processing of speech via web services. Computer Speech & Language 45: 326–347.
- Suzuki, Ryota / Hidetoshi Shimodaira (2006). Pvclust: an R package for assessing the uncertainty in hierarchical clustering. Bioinformatics 22.12: 1540–1542.
- Suzuki, Ryota / Hidetoshi Shimodaira / Maintainer Ryota Suzuki (2015): Package ‘pvclust.’ R topics documented 14.
- Ward Jr, Joe H. (1963): Hierarchical grouping to optimize an objective function. Journal of the American statistical association 58.301: 236–244. http://dx.doi.org/10.1080/01621459.1963.10500845
- Wiesinger, Peter (1983): Die Einteilung der deutschen Dialekte. Berlin: de Gruyter. http://dx.doi.org/10.1515/9783110203332.807
Diesen Beitrag zitieren als:
Link, Samantha. 2021. Vowels and the phonotactic clustering of German Dialects. Sprachspuren: Beiträge aus dem Deutschen Sprachatlas 1(3). https://doi.org/10.57712/2021-03.

